Visualizing embeddings generated by a model can be very helpful to see it’s performance, or to perform analysis of the effectiveness of the model.
To visualize embeddings, it’s only necessary to specify the following arguments:
results-filespecifies the path to theresults.pklfile generated by appying a model(see Applying a Model to New Data)outputspecifies the path to an output image or output path_to_output_folderembeddingspecifies the type of embedding that can be used. (Some of the available ones are TSNE, PCA and IsoMap)tensorboardspecifies that the embeddings should be output in a Tensorboard compatible format
For example,
python util/visualization/embedding.py --results-file ./output/test/test/classify=True/02-07-18-15h-46m-32s/results.pkl --output-file ./output.png --embedding tsne
would generate the image
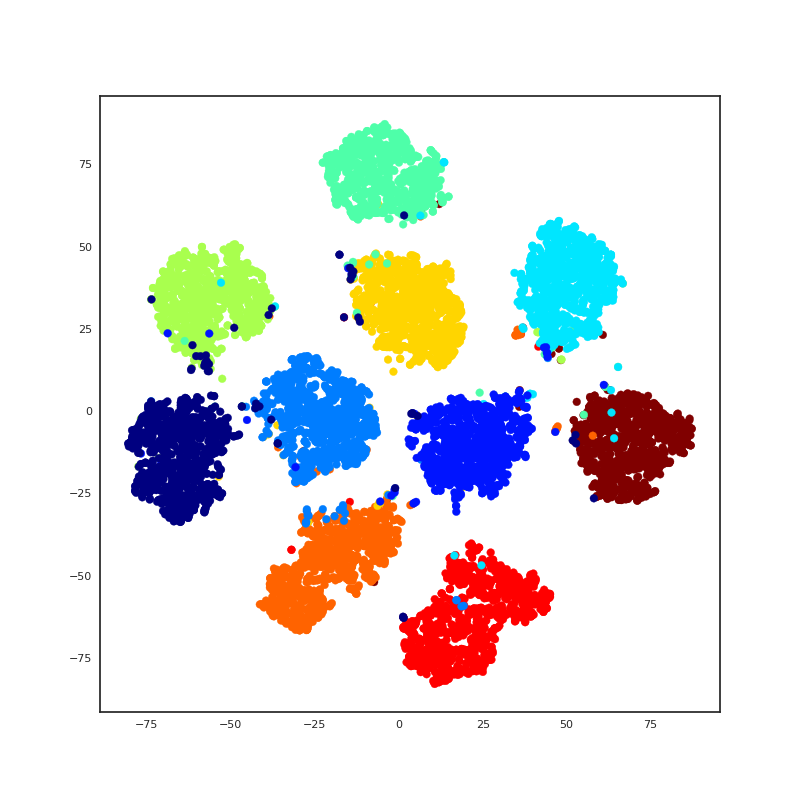
TensorBoard
This script can be used to output the embeddings in a Tensorboard compatible format.
python util/visualization/embedding.py --results-file <path_to_results.pkl> --output-file <path_to_output_folder> --tensorboard
These embeddings can be then visualized interactively using Tensorboard. For more information, refer to Visualizing the Results